|
On the previous page of this review, we observed that Surgenor's argument rests upon three assumptions: that juvenile crime is increasing, that large numbers of parents are raising children without spanking, and that these unspanked children are responsible for nearly all of the alleged rise in juvenile crime. First, let us examine Surgenor's claims about juvenile crime. He writes: "According to the U.S. Department of Justice, and the Federal Bureau of Investigation's Uniform Crime Reports, juvenile crime is increasing rapidly." (p. 89)As we shall soon discover, the above statement was false at the time Surgenor wrote his book and is false now. Juvenile crime in general has been decreasing markedly for years. Yet Surgenor continues to make this demonstrably false claim in other venues. For example, in a February 25, 2001 book review on Amazon.com, Surgenor writes, "The Uniform Crime Reports published by the FBI clearly indicate that juvenile crime has reached the epidemic stage." Anyone who actually reads the Uniform Crime Reports for themselves will quickly learn that they indicate nothing of the sort. This review is designed to make it as convenient as possible for one to view the relevant sections of the Uniform Crime Reports (UCR) and National Crime Victimization Surveys (NCVS) and draw one's own conclusion concerning the accuracy of Surgenor's statements. "There's a saying that 'liars figure, but figures can't lie.' To a certain extent that is true. But anyone with any intelligence at all knows that sometimes statistics can be manipulated to suit the manipulator's needs." (p. 46)Surgenor's statistics come primarily from the UCR along with a few anecdotes from case files as a Detective for the Juvenile Division in the town of Berea, Ohio. Berea is part of Cuyahoga County, a large district which includes the City of Cleveland. In his book's fourth chapter, "Kids and Crime," Surgenor presents several pages of graphs which show rising arrest rates of juveniles for several categories of offenses: domestic violence, murder, disorderly conduct, arson, vandalism, and weapons possession. The domestic violence graph (p. 50) provides data from 1983 to 1997, indicating that Surgenor had access to 1997 UCR figures at the time he compiled these statistics. However, his graph of juvenile arrests for disorderly conduct (p. 52) stops at the year 1996, even though 1997 figures were available to him. His other graphs stop at 1994. In each of the following tables, a link to each appropriate section of the Uniform Crime Reports from the FBI's webpage is included for the convenience of readers who would like to verify these figures for themselves. Readers are encouraged to do so. Surgenor claims that the UCR shows juvenile crime is rising. I assert that the UCR shows juvenile crime is falling. Clearly, one of us isn't telling the truth. The only way to know for sure is to go to the original source. You will need adobe acrobat reader to view the documents in the above link. (Pre-1995 Uniform Crime Report Data is not available on the web and hence the 1994 numbers below have no clickable links but may be accessed at your local public library in bound volume form). Let us now examine each of Surgenor's
six categories of juvenile arrests one at a time. As the first table
shows, arrests of minors for disorderly conduct in the USA took a sharp
downward
turn after 1996, and have continued downward in ever since.
This is clearly not the message Surgenor wants to send to his readers,
which may explain why he omits post-1996 disorderly conduct data from his
graph (p. 52).
Aside from the category "offenses
against children and family," (which will be discussed on Page Four of
this review), and the disorderly conduct data, all other categories of
juvenile crime for which Surgenor provides graphic data peaked in 1994
or earlier, and have trended downward ever since. Undaunted by data
which flies in the face of his central thesis, Surgenor truncates each
of these four graphs at 1994. Below are the most recent figures from
the F.B.I. for murder arrests.
The drop in juvenile arrest rates for
murder is quite striking. At the time Surgenor prepared his graphs,
the juvenile murder rate had been falling for several years.. The
following graph comes from the Office
of Juvenile Justice and Delinquency Prevention of the U.S. Department of
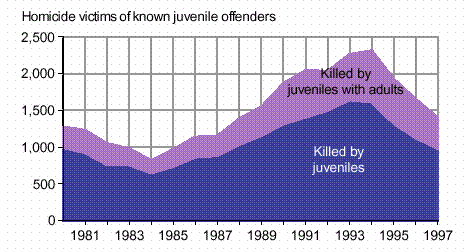
Justice. This graph displays data on the number of victims of
juvenile perpetrated homicides rather than the arrest rates as the above
table does, but the same distinct downward trend is evident in both sets
of data. Data for 1998 and 1999 is not shown in the graph below,
but juvenile homicide rates fell to even lower levels in those years.
(Click on the following link for a December 15, 2000 Associated Press wire
story: "Juvenile
Murder Rate at 33 Year Low.")
The sharp decline in juvenile-perpetrated murders after 1994 is clearly evident in the above graph. Surgenor's readers viewing his graph (p. 51) see only data from 1988-1994, and are left with the erroneous impression of a mounting bloodbath spiraling out of control. Surgenor can then blame this imaginary menace on teenagers who have never been spanked as children and hence have "no fear" deterring them from committing an alleged ever-rising wave of homicides. The 1988-1994 period is Surgenor's favorite time frame for quotable statistics on juvenile crime, even though his book was written no earlier than late-1998. During the 1988-1994 period U.S. national arrest rates for homicides and other violent crimes by juveniles did rise sharply. But a significant amount of the rise was caused by extreme levels of gang-related violence in a handful of inner city neighborhoods nationwide rather than an increase in murder rates by U.S. juveniles in general. According to the U.S. Bureau of Justice Statistics, even as recently as 1997 more than 1 in 4 juvenile homicides occurred in just 8 of the USA's 3,000+ counties (Source: Juvenile Offenders and Victims - 1999 National Report, p. 57). Arrests of juveniles also increased during this period as a result of the "War on Drugs," and concerns (later found to be groundless) about the possible future emergence of juvenile "super predators." In turn, this led to a "get tough" attitude towards juvenile offenders and a resultant increased policy emphasis on arrest and punishment as opposed to less heavy handed measures. Like his graph for juvenile-perpetrated
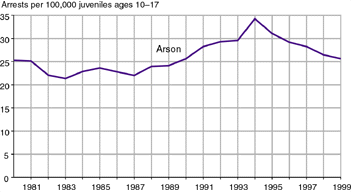
murders, Surgenor's graph (p. 53) for juvenile arrests
for arson also stops at 1994. The following table and graph provide
more recent data showing that the allegedly rising rates of juvenile arson,
which Surgenor attributes to the menace of unspanked children on the loose,
had actually already been declining for several years at the time
his book appeared in 1999.
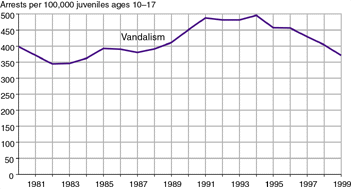
The graph in
Surgenor's book (p. 54) purporting to show soaring
juvenile vandalism rates leaves out all years after 1994. Note that
in every subsequent year after 1994 the arrest rates for vandalism
fell
rather than rose.
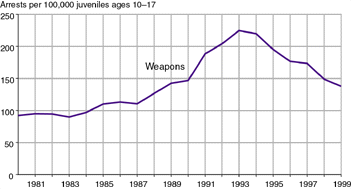
Surgenor also provides
his readers with no data about juvenile arrests for weapons possession
after the year 1994. Given the steady declines in these figures
since that year, it is not hard to see why. The following table gives
absolute numbers of arrests, while the graph provides per capita data.
Both show the same pronounced downward trend in the years since
1994.
The only UCR category of violent crime
for which juvenile arrest rates actually were rising at the time
Thus far, we have examined Surgenor's claim of a general rise in juvenile violence, and found it to be without merit. Now let us turn to Surgenor's claims about the alleged rise in the percentage of crimes perpetrated by juveniles. In each of his six crime data tables (pp. 50-55) Surgenor shows only periods during which juvenile crime was rising faster than adult crime. As the following table shows, the juvenile Crime Index rate is falling faster than the adult rate for all five of the most recent years for which web-based UCR data is available. The 1999 UCR defines the "Crime Index" as follows: "The Crime Index is composed of selected offenses used to gauge fluctuations in the overall volume and rate of crime reported to law enforcement. The offenses included are the violent crimes of murder and nonnegligent manslaughter, forcible rape, robbery, and aggravated assault and the property crimes of burglary, larceny-theft, motor vehicle theft, and arson."The percentage of serious crimes committed by juveniles has been growing smaller each year for several years now. This trend was already well established at the time Surgenor wrote his book, in which he claimed that the opposite was happening and falsely alleged that the UCR data proved his point.
The following table further belies
Surgenor's assertion that juvenile crime is increasing as a percentage
of total crime. In fact, it had been trending steadily downward
for four years at the time Surgenor's book appeared.
Surgenor claims that we live in a more violent society than in the past. "Look around, folks. What do you see? Are children better behaved now than when we were young?... Implementation of the liberal philosophical and psychological "theories" has resulted in a society that is more violent and less respectful of authority and the rights of others." (p. 14)Surgenor also argues that juvenile crime is in a long term upward trend. "Without any doubt there is a steady increase in crime by committed juveniles over the last twenty years." (p. 48)Surgenor is simply wrong. Juvenile crime rates were much higher twenty years ago than they are now. His book appeared in 1999. Twenty years earlier, according to the Uniform Crime Reports, 1979 juvenile arrests for all crimes totaled 2,143,369 while in 1999 the total was only 1,082,022, a decrease of nearly 50% in comparison to twenty years earlier. And this does not take into account the fact that the 1999 juvenile population was over 12% greater in numbers than the 1979 juvenile population (70.2 million versus 62.6 million). In other words, today's youngsters collectively commit barely more than half as many crimes as juveniles of twenty years ago, even though there are now more of them. Surgenor dismisses all evidence of a downtrend in crime by alleging that Uniform Crime Report data from 1992 onward is not reliable. Nevertheless, he repeatedly cites post-1992 juvenile crime data for various categories of arrest rates whenever it shows increases of one sort or another, but labels it "inaccurate" whenever it fails to indicate a rise in juvenile crime, and he claims, without evidence, that "Little does the public know that the crime rate is exploding. It just isn't being reported" (p. 43).How does Surgenor know about crimes which allegedly "aren't being reported?" Only Surgenor knows for sure. He does not supply his readers with any alternative source of national crime rate information to support his oft-repeated assertions about a rise in crime which the FBI figures allegedly fail to record. And as we have already seen, Surgenor has publicly alleged as recently as February of 2001 that the UCR shows we are in the midst of a juvenile crime "epidemic," when it actually shows just the opposite. There is simply no way he can honestly argue that the UCR proves we are currently in a juvenile crime epidemic, and then simultaneously claim that the UCR's data showing a continuing drop in juvenile crime is the result of "inaccuracies." Either the UCR supports his claim or it doesn't. Either its figures are accurate or they aren't. Surgenor strives to have it both ways, depending upon his rhetorical needs of the moment. Page Three of this review shall examine Surgenor's argument for the alleged unreliability of the FBI's crime data. As we shall soon learn, his argument is utterly without merit. Page Three: National Crime Statistics are Accurate and Contradict Surgenor's Claims Page Four: Juvenile Crime is on the Decline Even in Surgenor's Home District Page Five: Surgenor's Own "Research" Fails to Withstand Critical Scrutiny
Return to Home Page |


